Semiconductors Didn’t Rally — Memory Did. And 88% of It Was Price, Not Demand
💎 Semiconductors Didn’t Rally — Memory Did. And 88% of It Was Price, Not Demand
Welcome back, everyone! 📊 I’m your Quant Analyst, filtering out market noise using data, statistical modeling, and systematic insights. 👩💻✨
I sat down to write about why semiconductors have surged, and the first thing I checked contradicted the question. To cut straight to the chase: the broad chip index is well below its June peak — what actually surged is memory, and Micron’s own filing says roughly 88% of that growth came from higher prices rather than shipping more product.
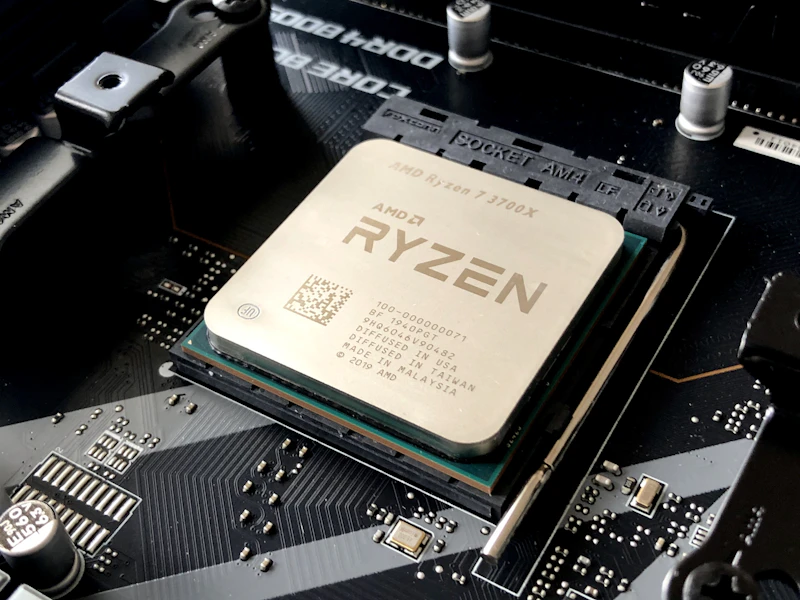
▲ “Semiconductors” is not one trade. The memory slots next to the processor are having a completely different year from the processor
📌 First, the actual numbers
From Micron’s Form 10-Q for the quarter ended May 28, 2026: revenue $41.46 billion, versus $23.86bn the prior quarter and $9.30bn a year earlier — +346% year over year. Gross margin 84.6%. And the decomposition, in the company’s own words: DRAM sales rose 343% “primarily due to a low-260% range increase in average selling prices and a low-20% range increase in bit shipments”; NAND sales rose 361% on “a mid-310% increase in average selling prices and a low-double-digit increase in bit shipments.” Micron reports its next quarter on September 30, 2026.
Source: Micron Technology Form 10-Q, quarter ended 28 May 2026 (SEC EDGAR). Peer revenue figures from the same companies’ filings via XBRL; growth decomposition is my calculation.
1. The premise needed fixing first
The chip sector is not moving as a block. Taking each company’s most recent reported quarter against the same quarter a year earlier, straight from the filings:
| Company | Latest quarter | Year earlier | Growth |
|---|---|---|---|
| Micron (memory) | $41.5bn | $9.3bn | +346% |
| Nvidia | $96.2bn | $46.7bn | +106% |
| Broadcom | $29.6bn | $16.0bn | +86% |
| Intel | $16.1bn | $12.9bn | +25% |
| Texas Instruments (analog) | $5.5bn | $4.4bn | +23% |
A fifteen-fold spread in growth rates inside one “sector.” I worked through that cross-section in detail in an earlier post on what Nvidia’s surge says about every other chip stock, so I won’t re-argue it here. What I want to do instead is go inside the outlier and ask what kind of growth +346% actually is.
2. Revenue growth has two ingredients, and companies tell you the recipe
Any revenue change decomposes into price and quantity. Most companies leave you guessing. Memory manufacturers don’t — because bits shipped and average selling price are the two numbers the industry runs on, they disclose both. Micron’s 10-Q gives the split in plain language, and it is startling.
Price vs Volume: Where the Growth Came From
*My calculation from the ranges Micron states in its 10-Q, split in log terms so the two contributions sum to 100%. Micron gives approximate ranges, so treat these as close estimates rather than exact figures.
Year over year, DRAM average selling prices rose about 260% while bit shipments rose about 20%. For NAND: prices up roughly 310%, bits up low double digits. Sequentially it is even starker — DRAM revenue rose 67% on a 62% price increase and a low-single-digit volume increase.
Put plainly: Micron is not selling meaningfully more memory. It is selling roughly the same amount of memory for several times the price.
That is not a criticism — it is an enormously profitable position to be in, and the company deserves credit for the supply discipline and the HBM positioning that got it there. But it changes what you are underwriting. Volume growth reflects demand you can extrapolate. Price growth in a commodity reflects a shortage, and shortages are resolved by supply.
3. The margin line tells you what kind of event this is
If you want one number that captures how violently cyclical this business is, use gross margin. Same company, same product category, twelve recent quarters:
From Selling Below Cost to an 85% Margin
*Quarterly gross margin computed by me from Micron’s reported revenue and cost of revenue (SEC XBRL). Gaps between points are quarters not separately tagged in the data.
In the quarter ended March 2023, Micron’s gross margin was −32.7%. It was selling memory for meaningfully less than it cost to make. Three years later it is +84.6% — a swing of roughly 117 percentage points in the same business making broadly the same product.
No software company swings like that. No analog chipmaker does either — and that is precisely why Texas Instruments grew 23% while Micron grew 346%. Memory is the part of semiconductors that behaves like a commodity, and commodity margins are mean-reverting by construction: an 85% margin is the loudest possible signal to every competitor to add capacity.
4. Let me make the bull case properly
Three reasons this cycle might genuinely be different
One — HBM is not a spot commodity. High-bandwidth memory for AI accelerators is sold on long-term agreements with qualified customers, and qualification takes years. That is a real structural barrier that plain DRAM never had, and it makes some of this pricing far stickier than the word “commodity” suggests. Two — supply takes years, not quarters. A new fab is a multi-year, multi-billion commitment; the usual self-correction mechanism is unusually slow this time. Three — the demand source is new. Previous memory cycles turned on PCs and phones. This one turns on data-centre buildout, which is currently being funded on a scale no prior cycle saw. If that spending holds, the shortage can persist far longer than history suggests.
I take those seriously. What I would not do is treat them as reasons to ignore the price/volume split — they are arguments about how long the price stays high, not arguments that the growth was driven by something other than price. Both things are true at once.
5. What I’ll be reading tomorrow
Micron reports fiscal Q4 on September 30. The headline revenue number will be large and will tell you almost nothing, because we already know prices were up. The lines that carry information:
- Bit shipment growth, stated separately from ASP. This is the one that distinguishes real demand from a price spike. If bits are still growing low-single-digits sequentially while prices carry the quarter, the character of the boom is unchanged.
- Capital expenditure guidance. An 85% margin should pull capex up across the industry. The moment Micron, SK Hynix and Samsung all guide capex sharply higher is the moment the supply response starts — and it shows up in guidance a year or more before it shows up in prices.
- Inventory, at Micron and at its customers. Memory downturns almost always begin with customers who over-ordered during the shortage working through stock. Falling days of inventory is healthy; rising is the early warning.
Quick FAQ
Q. So is this a bubble?
I don’t think that’s the right word, and I can’t tell you what the stock does next. The earnings are real, audited, and enormous — this isn’t a story about a promise. The narrower and more defensible statement is that the earnings are price-driven, and price-driven earnings in a commodity have historically not been valued at the same multiple as volume-driven earnings, for good reason.
Q. Doesn’t AI demand mean memory prices stay high forever?
AI demand explains why prices rose. It does not by itself explain why they stay high, because the response to high prices is new capacity, and three manufacturers are all capable of adding it. The question is a race between demand growth and supply additions, and the capex guidance in section 5 is where you actually observe that race.
Q. What would change your mind?
Bit shipments accelerating into double-digit sequential growth while prices merely hold. That would mean the volume is finally showing up and the story is demand rather than scarcity — which is the durable version of this trade, and the one I am not currently seeing in the filing.
💡 Quant Strategy & Takeaways
“Semiconductors” hides a fifteen-fold spread in growth: Micron +346%, Texas Instruments +23%. And by Micron’s own 10-Q, roughly 88% of DRAM’s growth and 93% of NAND’s came from price, with bit shipments up only about 20% and low double digits. Gross margin went from −32.7% to +84.6% in three years. Read the bit-shipment line on September 30, not the revenue headline.
When market volatility spikes, remove emotion and focus strictly on the numbers! 🤖
When you see a revenue number explode, do you check whether it was price or volume? Let me know in the comments! 📈✨
Disclaimer: This article analyses public SEC filings for educational purposes and is not financial or investment advice. Micron discloses price and volume changes as approximate ranges, so the decomposition here is an estimate. Fiscal calendars differ between the companies compared. Past cycles do not predict future ones. Always do your own research or consult a licensed financial advisor before investing.

Comments
Post a Comment